
The Election, Tax Policy and the Economy
In a previous post, we noted that some very important issues have not gotten much attention in this campaign season. We cannot tell you who to vote for – hence the silenced Head Smacker. But we can describe the Clinton and Trump tax proposals, and what the evidence says their impact is likely to be on the economy.
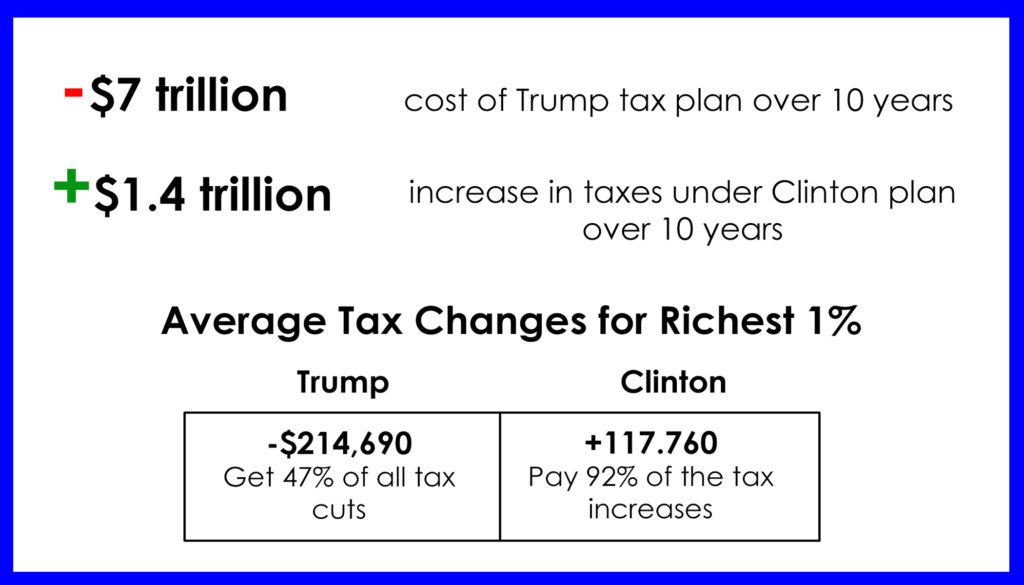
In Part 1 of this blog series, we covered the cost of their tax plans, who benefits, and who pays more. Today, we’ll look at their economic impact.
But first, a key facts refresher:
How do the plans affect broadly shared economic growth?
Proposals that reduce taxes for the highest income groups claim that tax reductions concentrated at the top will result in job creation and economic growth. Those proponents also contend that increasing taxes on the wealthy and corporations will strangle economic growth. This is not just a matter for speculation, though. There is evidence about what really happens, both from looking at tax cuts and economic growth over time, and from looking at states within the U.S. that have tried tax reduction strategies.
What does the evidence show?
Tax cuts can spur some economic growth, but looking at a truckload of findings, it stands out that tax reductions are no guarantee of a better economy, and higher tax rates do not hold back economic growth.
The Congressional Research Service compiled growth rates over time, and found that from 1950 – 1970, the top marginal tax rate on labor income was 84.8 percent, and the top marginal rate on capital gains was 25.6 percent. During those two decades, the economic growth rate (GDP) averaged 3.86 percent. By 1987 – 2010, the top rate on labor income had plunged to 36.4 percent, and the capital gains top marginal rate was 23 percent. Economic growth was lower, not higher – it was 2.85 percent for this period.
A lot of things were going on over these long periods. We don’t claim that high top tax rates caused the higher growth. But they didn’t get in the way of it, and reducing top rates did not spur economic gains.
That’s true when you look at more recent experience. See this comparison of the Bill Clinton tax increases of the 1990’s and the George W. Bush era tax cuts in the early 2000’s, courtesy of the Center on Budget and Policy Priorities:
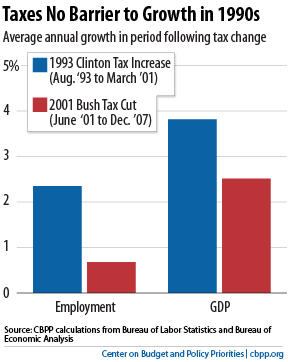
The graph above is particularly helpful because it uses an important measure of shared economic growth: employment levels. GDP can rise, with all the gains going to people at the top. That’s what happened in the first years of the recovery from the Great Recession. But employment is a measure of how all of us are doing, and all of us did much better after the Clinton tax increase than we did after the Bush tax cuts.
One more example: the experience in Kansas. Kansas, under Governor Sam Brownback, enacted large tax cuts starting in 2013, in which the top income tax rate dropped from 6 percent to 4.5 percent, and the tax on income earned by small businesses that was formerly reported on individual income tax forms was cut to zero. There was growth in Kansas from 2013 to 2016, a period of national recovery from the 2008-2009 recession. But Kansas grew far less than the national average. Employment rose by 2.6 percent in Kansas, but 6.5 percent across the nation. GDP in Kansas grew 4.8 percent, but rose nationally by 11.9 percent.
And this gets us to another point: proponents of big tax cuts say that the economic growth they spark will lead to more taxes being paid, so revenues will not drop as much as you’d think. Well…no. In Kansas, revenues plummeted, with the tax take in 2016 $570 million lower than in 2013, even after counting increases enacted in sales and cigarette taxes. The economic growth that did occur from cutting taxes was estimated to bring in about $30 million, leaving the state very deeply in the hole.
The Take-Away:
When you look at a candidate’s tax proposals, bear in mind that big tax cuts favoring those at the top have in the past not paid off in terms of increased employment or economic growth. They lose revenue, and therefore increase the pressure to cut programs. That is why we have been cutting education, job training, housing, and many other federal programs that can help prepare people to share in economic growth. That is why we have been failing to maintain and modernize our roads, bridges, public transit and public buildings.
Early analyses of the full Clinton and Trump economic plans (tax and spending) by Moody’s Analytics found that the Trump plan would cause a recession and the Clinton plan would create 10.4 million jobs over ten years, or 3.2 million more than by continuing current law. Admittedly, Moody’s look at Trump’s plan was before he drastically reduced the size of his proposed tax cuts. But the tax cuts are still very large, and Moody’s analysis includes the scenario that Congress would scale back the massive extent of Trump’s initial plan.
Mr. Trump is not alone in proposing large tax cuts targeted to the highest income groups. This year, House Republicans proposed a $3.1 trillion tax cut over the next decade. This plan would in 2017 provide three-quarters of its tax reductions to the top one percent, whose average tax cut would be $212,660. The top one-tenth of one percent would average $1.26 million in tax reductions. The House plan also calls for giant spending cuts, of which $3.7 trillion are estimated by the Center on Budget and Policy Priorities to affect low- and moderate-income people.
Proponents of large tax cuts for those at the top content they will generate economic growth, and will trot out economic projections to boost their claims. But projections are not the same as evidence from actual past performance. And the real world evidence – whether from decades of national economic data or from the current tax cut experiments in Kansas – tells us that tax cuts at the top do not unleash economic growth and jobs, and do lead to massive revenue loss. On the other hand, revenue increases at the top, combined with investments in infrastructure, education, housing, health care, etc. as well as reductions in family child care and other costs, have created jobs and boosted income in the past, and can do so again.
This post was originally published on the Coalition on Human Needs' blog, Voices for Human Needs. Receive similar articles in your inbox by subscribing today, and follow CHN on Facebook and Twitter.
Related Posts

The views and opinions expressed in this post are those of the author(s) and do not necessarily reflect those of MomsRising.org.
MomsRising.org strongly encourages our readers to post comments in response to blog posts. We value diversity of opinions and perspectives. Our goals for this space are to be educational, thought-provoking, and respectful. So we actively moderate comments and we reserve the right to edit or remove comments that undermine these goals. Thanks!