

Why does it feel like it is so hard to afford a decent life? Not decadent, not luxurious, just decent. And why does it seem like it used to be easier to afford that decent life?
There is a very straightforward explanation that answers both of these questions. An economist would say, it comes down to the ‘relative growth in prices and wages.’
So what does that mean?
At the heart of the matter, the problem is that runaway price growth for the necessities has outpaced wage growth for all earners, but especially middle earners. Now, tariffs, deportation, health care cuts, child care cuts, or tax cuts–these policies are all poised to make a bad situation worse.
My name is Kathryn Anne Edwards. I’m a PhD labor economist. I used to work at a research institute in what was mostly a steady and predictable 9-5 job. But after I had two kids during the pandemic, I found even steady and predictable was too much for me to manage. I quit and started my own business so I could have more control over my schedule. I had to give up a lot of what I worked on in my career, but I gained a lot of freedom and room to be creative. I built up a client list and embarked on becoming a social media influencer, explaining the economy one video and tweet at a time. I’m now a columnist for a national publication, have a quarter of a million followers, and started my own podcast Optimist Economy.
Our lives have to change after we have kids, and we don’t know how it will change us and what that will bring. It helped me find my voice in bringing explanation and clarity to the issues Americans want to understand.
Politicians, pundits, talking heads—they aren’t so good at cause and effect because they have an agenda. They talk about the economy in a way to get you to agree with them. My agenda is for you to be informed. I talk about the economy in a way to get you to understand. Economics is hard and complicated, but we all live and depend on this economy, which means we all have the right to understand what’s going on.
This is a first in a series of economic explainer articles, beginning with the basics so we’re all on the same page.
Starting with: Relative growth in prices and wages.
Affordability is a two-way street
The idea of something being cheap or expensive isn’t just about its price, but its price relative to your earnings. Is $100 for a dinner cheap? Depends. It’s cheap if you make $250,000 in a year, but it’s expensive if you make $25,000. If something is hard for you to afford, it’s a function of both how much it costs and how much you have.
The question about affording a decent life is big—it’s not just dinner, but all the things that comprise a decent life, from things you need to have to things you feel you ought to have—but it comes down to the same concept of how much it costs (price) and how much you have (earnings).
On paper at least, Americans are richer than they used to be.
(Don’t worry, I’m not trying to gaslight you or any difficulties you have and say, “Actually everything is great in the economy and you’re just doing it wrong.” Everything isn’t great. Showing how it is both factually correct that Americans are richer but functionally wrong in many people’s lives is how I’ll explain relative growth.)
It’s easiest to see our on-paper improvements by looking over long periods. In 1973, the average hourly wage in the U.S. was $3.90 and by 2024 it was $34.27. That’s a 773% increase over those forty years! Prices were growing too, 607% over the same time. Put them together and you get average real wage growth—the growth in wages net of the growth in prices—of 48%. Put differently: If you look at the average wage and average price, a typical hour of earnings in the U.S. today should be able to buy much more than that same hour of earnings would have been able to buy in 1973.
Instead, it feels like it’s getting harder to afford things, rather than easier.
So, what’s going wrong?
Runaway Prices…
A big part of what’s going wrong is that not all prices grow at the same pace as the average (And not all wages rise at the same rate either. More on that later). In the table below, I take a set of goods and services and arrange them by whether their price is growing slower or faster than prices overall since 2001. This data goes through 2024, the last year of annual data; you can think of this as the ‘origin story’ for the bad situation we’re in today.
The first two columns list out things with slower than average price growth and the right two columns list out things with faster growth.
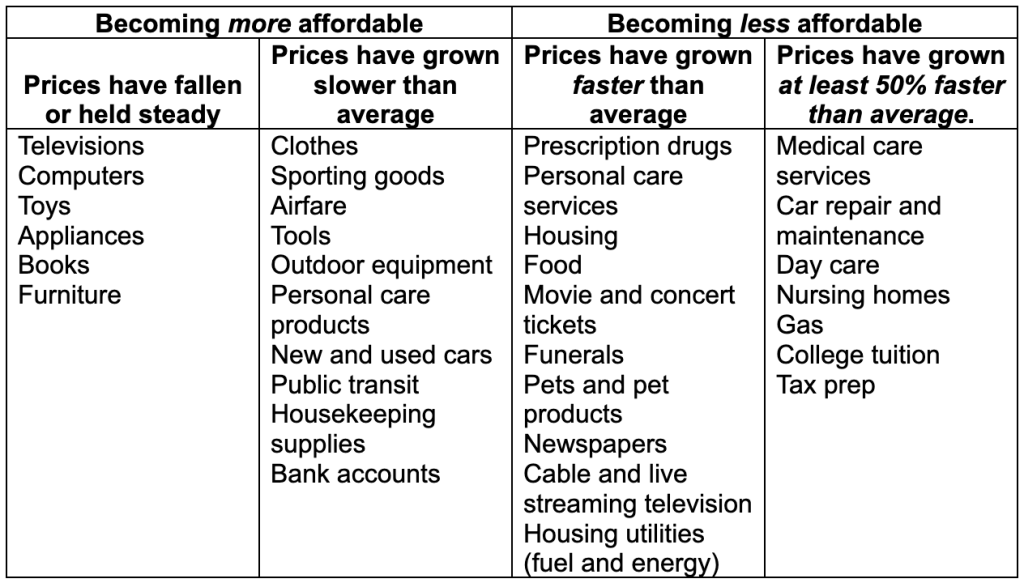
Consumer goods—think of this as what you could bring home from a Target or Best Buy run—have become relatively cheaper over the past 25 years because their prices have been rising slower than average.
Necessities, on the other hand—housing, food, utilities, prescription drugs, health care, child care, elder care, higher education, gas—have gotten relatively more expensive because their prices have been rising faster than average.
In sum: It’s getting easier to afford non-essential stuff as it’s getting harder to afford the essentials, the hallmarks of a decent life.
In the grand scheme of things, most of us live in some kind of modern luxury of consumer goods, but struggle with the basics. Many have the comfort of a refrigerator, TV, car, microwave, all the furniture wanted or needed inside and out, a closet full of clothes, a smartphone, and yet can feel like we are living on the brink. The situation is uneven: Many can afford things that aren’t needed and still struggle to afford things we need like childcare and healthcare.
Frankly, it’s exactly what the relative growth in prices would predict. And that’s only half the problem.
…Meet Uneven Wages
High prices, even for the necessities, aren’t a problem if wage growth still outpaces them. For instance, the cost of college tuition has increased 169% since 2001. That’s a problem if wages only grew 100% over the same period, but an inconvenience if wages grew 200%.
Much like prices of different goods and services growing at an uneven rate, wages also have not grown at an even rate.
You need a little bit of backstory to understand this. I said earlier that since 1973, the average wage in the US grew 48%, taking into account the growth in prices. But those gains weren’t steady over those 50 years, nor were they shared. Not all workers saw their wage grow at the same pace as the average did.
Think of workers as belonging to one of three groups: The bottom 30% of earners, the middle 60%, and the top 10% of earners. Those 50 years can be divided into two eras.
- 1973-2000: Inequality opens up.
- Wages at the top consistently grew much faster than average.
- Wages at the middle consistently grew much slower than average.
- Wages at the bottom were flat or falling in the 80s, but came up to the average growth in the 90s.
- 2001-2024: The middle struggles.
- Wages at the top and bottom grow faster than average.
- Wages at the middle are still slower than average.
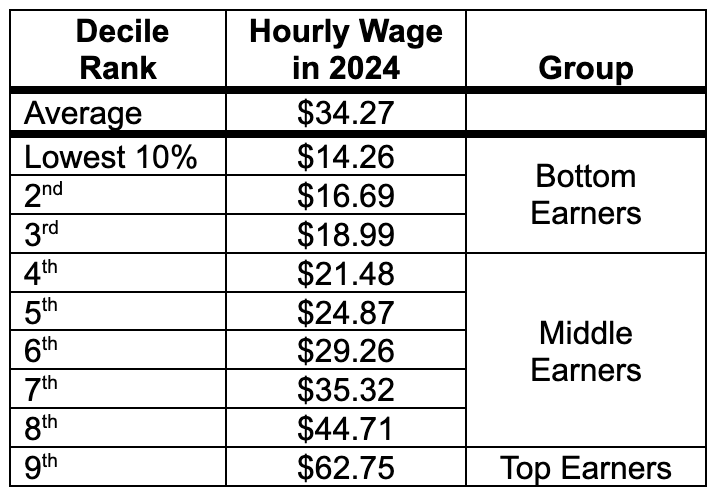
In the next table, I give a summary of U.S. hourly wages. If you were to line up every wage earner in the U.S., rank them from lowest to highest earning, and divide them into ten equal size groups, the cutoffs between the groups are called the ‘decile cutoffs.’ The US has 161 million workers, so the ten groups would each have about 16 million people in them. The table shows the average across all workers (in the first row) and then the decile cutoffs (in the next rows).
For example in the second row of the table, the lowest 10% of earners are those 16 million workers who earn at most $14.26 an hour. In the last row of the table, the top 10% are those 16 million workers who earn at least $62.75 an hour.
Or, if we think of the three groups, shown in the final column of the table: the bottom group is the 48 million workers who earn less than $18.99 an hour, the middle is the 96 million workers who earn between $18.99 and $62.75, and the top is the 16 million who workers who earn at least $62.75.
So who can afford things in 2024? That’s a two-part question of: 1) How much they earn in 2024 and; 2) How those earnings have grown relative to prices.
For reference, a person who worked every hour of the week every week of the year at $20 an hour would bring home just under $3500 a month, quickly outstripped by the typical monthly costs for rent ($1400), a new mortgage ($2300), utilities ($385), child care for one kid ($546-$1300), food ($830), health care ($500), and the cost of maintaining a car ($550).
In other words, the bottom earners don’t earn enough to afford these necessities, however much they’ve benefited from faster wage growth recently.
In contrast, a person who worked every hour of the week every week of the year as a top earner at $62 an hour would bring home $10,750 a month. It’s healthy enough to afford the necessities even as they become more expensive.
The real problem is that most people are in the middle, and the middle is not doing as well. Their wages aren’t high enough to overcome the high price of necessities, while at the same time necessities are becoming less, instead of more, affordable.
Putting it Together
It’s not just that the price of necessities has risen faster than prices overall, they are also rising faster than most wages overall. In the next table, I compare price growth and wage growth since 2001.
As you can see, college, gas, nursing homes, car repair, medical care—their prices have risen faster than anyone’s wages. Utilities for housing are not far behind them, rising faster than the wages of most earners. Meanwhile for the middle earner, their wages are barely keeping up with housing and food.
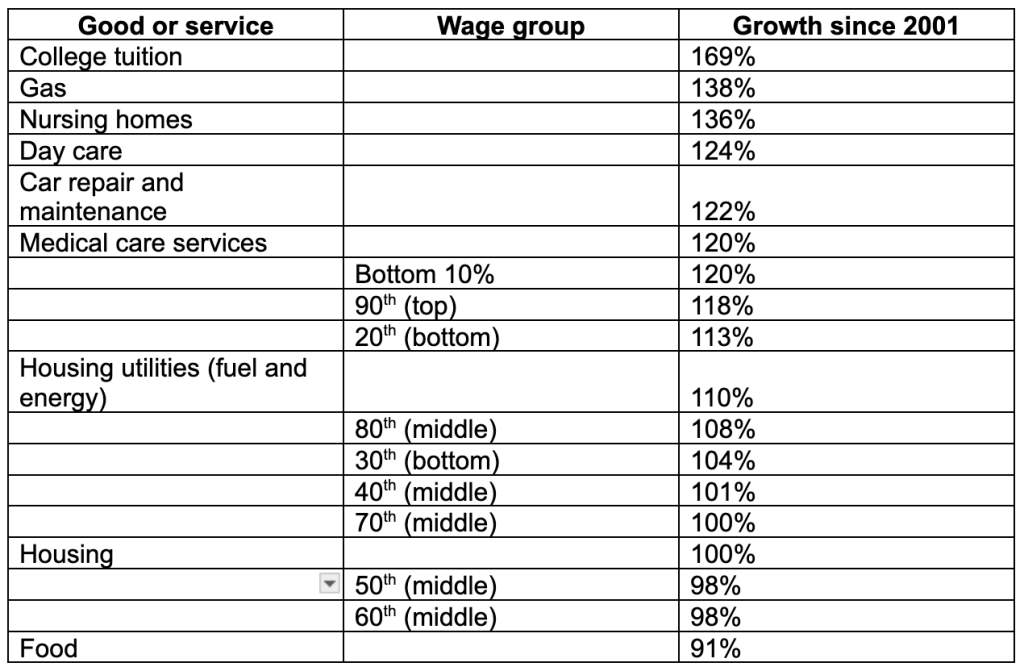
This is a table with a lot of numbers, and the numbers don’t really mean anything—what’s 91% versus 108%, really?—but consider what this table should look like. It should be that wage growth for everyone working in the economy outstrips the price of things we all need to live in the economy. But instead it shows workers, especially those in the middle, struggling to keep up.
This isn’t the full story, by any means. To start, this is just hourly earnings. It doesn’t include other sources of income, like investments, or things that aren’t income, like employer health insurance. It also doesn’t account for having two earners in a family or other factors, like if someone owns their home outright or if they are in an expensive city.
And this discusses wages for all workers; it doesn’t take into account the big gaps in earnings between workers: women make about 18% less than men, while Black and Hispanic workers make about 12% less than white workers. And it’s not as if the disparity stops there, motherhood is associated with a significant pay penalty, and moms of color experience compounded disparities. (More on this in future parts of this series.)
But, what I’ve written about here–explaining the relative growth of wages and prices–gets at the heart of what’s driving many people to feel and experience that a decent life is harder to afford in America today: the price of a decent life has shot up, while their wages haven’t.
The Wrong Solutions for Today
All of this is setting the scene; it covers historical data that explains the situation our economy is in. It presents a clear challenge to policymakers: something needs to be done to curb the price growth of necessities.
Unfortunately, the key economic policies of this Trump Administration have all been counterproductive to address key economic hurdles that many (most!) families are facing right now. Here’s a short breakdown on what’s happening in this moment, aka, the bad situation getting worse:
Tariffs
Are an import tax. They make goods that come from abroad, or the use of parts that come from abroad, more expensive. The price increases from tariffs will primarily affect consumer goods and food. As I explained above, consumer goods have seen relatively low or no price growth this century up to now. Americans are seeing spikes where they were accustomed to low, stable prices.
Plus, tariffs also have a secondary effect of adding uncertainty to economic policy. Most of the tariffs have been announced, reversed, reinstated, announced again, and so on. Without a clear idea of how much imports cost, businesses are unable to plan, which means they are unable to expand or hire.
Uncertainty is a slow way to sink the economy, but it can sink it. And within six months of tariffs, the data is showing it. Growth in household spending and business spending is half of what it was last year. Job growth has slowed to a crawl, averaging just 35,000 over the last three months. At the same time, prices keep ticking up. Not jumping up, but moving in the wrong direction.
(Trump’s anger about these data—most of which arrived in a single week in July 2025—led him to fire the commissioner of the Bureau of Labor Statistics and falsely accuse her of manipulating the data for political purposes.)
Deportation
Mass deportation has been announced and funded, but is only just starting to come into effect. The vast majority of undocumented immigrants are working and paying taxes, and their removal could easily create labor shortages in industries like food production, construction, and care work. Labor shortages means product shortages for consumers, higher prices for consumers, or both.
Health Care Cuts
The One Big Beautiful Bill passed the single largest cut to health care in U.S. history, stripping nearly $1 trillion from Medicaid and cutting subsidies to the individual market. The result will be more uninsured Americans and higher healthcare costs. It’s an accelerated deterioration of America’s already flawed and failing health care system.
Tax Cuts
The purported salve for all of the economic pain has been said to be $4.5 trillion in tax cuts included in the One Big Beautiful Bill. They come on the heels of $2.1 trillion in tax cuts in 2017, $3.6 trillion in cuts in 2012, and $1.5 trillion in cuts in 2001. The problem with tax cuts is that they are a weak policy that comes with an extremely high price tag. They are both large in total costs but small in how much they actually help families.
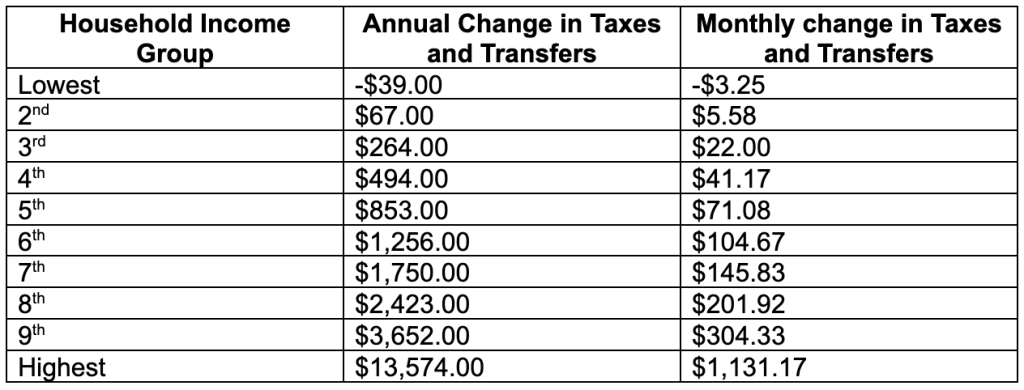
The Congressional Budget Office estimated the amount of cash households would get back annually from the bill. Again, this estimate is by deciles—ten equal groups of Americans arranged from poorest to richest—only in this case it’s not hourly earnings of individuals, but total income of families.
The lowest income households lose money in the bill—about $40 a year. The richest income households get back over $13,000. But the real problem is all the households in the middle. Keep in mind that each decile here represents over 15 million families.
For example, the 5th group is truly the middle American household, and they’ll see all of $71 a month extra because of the tax bill. That won’t do much for rent, gas, food, mortgage, or child care or elder care, if they are paying for it. It barely covers a single copay for a doctor’s visit, maybe two, but certainly not a month’s health insurance premium. It probably wouldn’t cover a single utility. This is the problem with tax cuts in general: it costs a lot to give over 150 million families money, so you can’t give them that much. The amount they get back is paltry in comparison to their economic needs.
But What About…[politician/political party I don’t like]?
Americans did not start struggling to afford a decent life in January of this year. The problem we feel at this moment was truly decades in the making. On some level, putting it this way leaves a lot of cover for people who want to blame a politician or political party they don’t like, or to try to absolve from blame a politician or political party they do like. If the problem developed over a long period of time, people get to pick who in the past they blame for it.
I’m empathetic with a need to point fingers, but as an economist, I can be pretty dismissive of it. What’s more important is helping Americans. So many are struggling to make ends meet, feel like their life is an emergency. We need to focus on whether current policies are helping or hurting, and how they are shaping the future. That requires correctly diagnosing the problem in order to find the most effective solutions – and it also requires accessing the solutions being put forward. As you can tell from the words on these pages, the core problem is that runaway price growth for necessities has outpaced wage growth for all earners, especially middle earners. Now, the problem of rising costs is being made worse because many of the policies proposed as so-called solutions – including tariffs, deportation, health care cuts, child care cuts, or tax cuts – aren’t solutions at all. In fact, those policies are poised to make a bad economic situation worse.
*COMING UP IN THIS SERIES: I’ll talk about my ideas for solutions, how much they cost and what the U.S. can afford to do; wage gaps and discrimination in the labor market; labor market policy that supports mothers and doesn’t cost anything; and more.
Related Posts


The views and opinions expressed in this post are those of the author(s) and do not necessarily reflect those of MomsRising.org.
MomsRising.org strongly encourages our readers to post comments in response to blog posts. We value diversity of opinions and perspectives. Our goals for this space are to be educational, thought-provoking, and respectful. So we actively moderate comments and we reserve the right to edit or remove comments that undermine these goals. Thanks!